Welcome to Wakelog
Your sailing voyage logbook. Upload GPX tracks from your GPS, view them on an interactive globe, and build a rich record of where you've sailed — complete with weather, photos, crew, and notes.
Overview
Wakelog is a sailing voyage logbook. You upload GPX track files recorded on your GPS or chartplotter, and Wakelog displays them on a Mapbox globe with performance stats, weather data, and the ability to attach photos and notes to each passage.
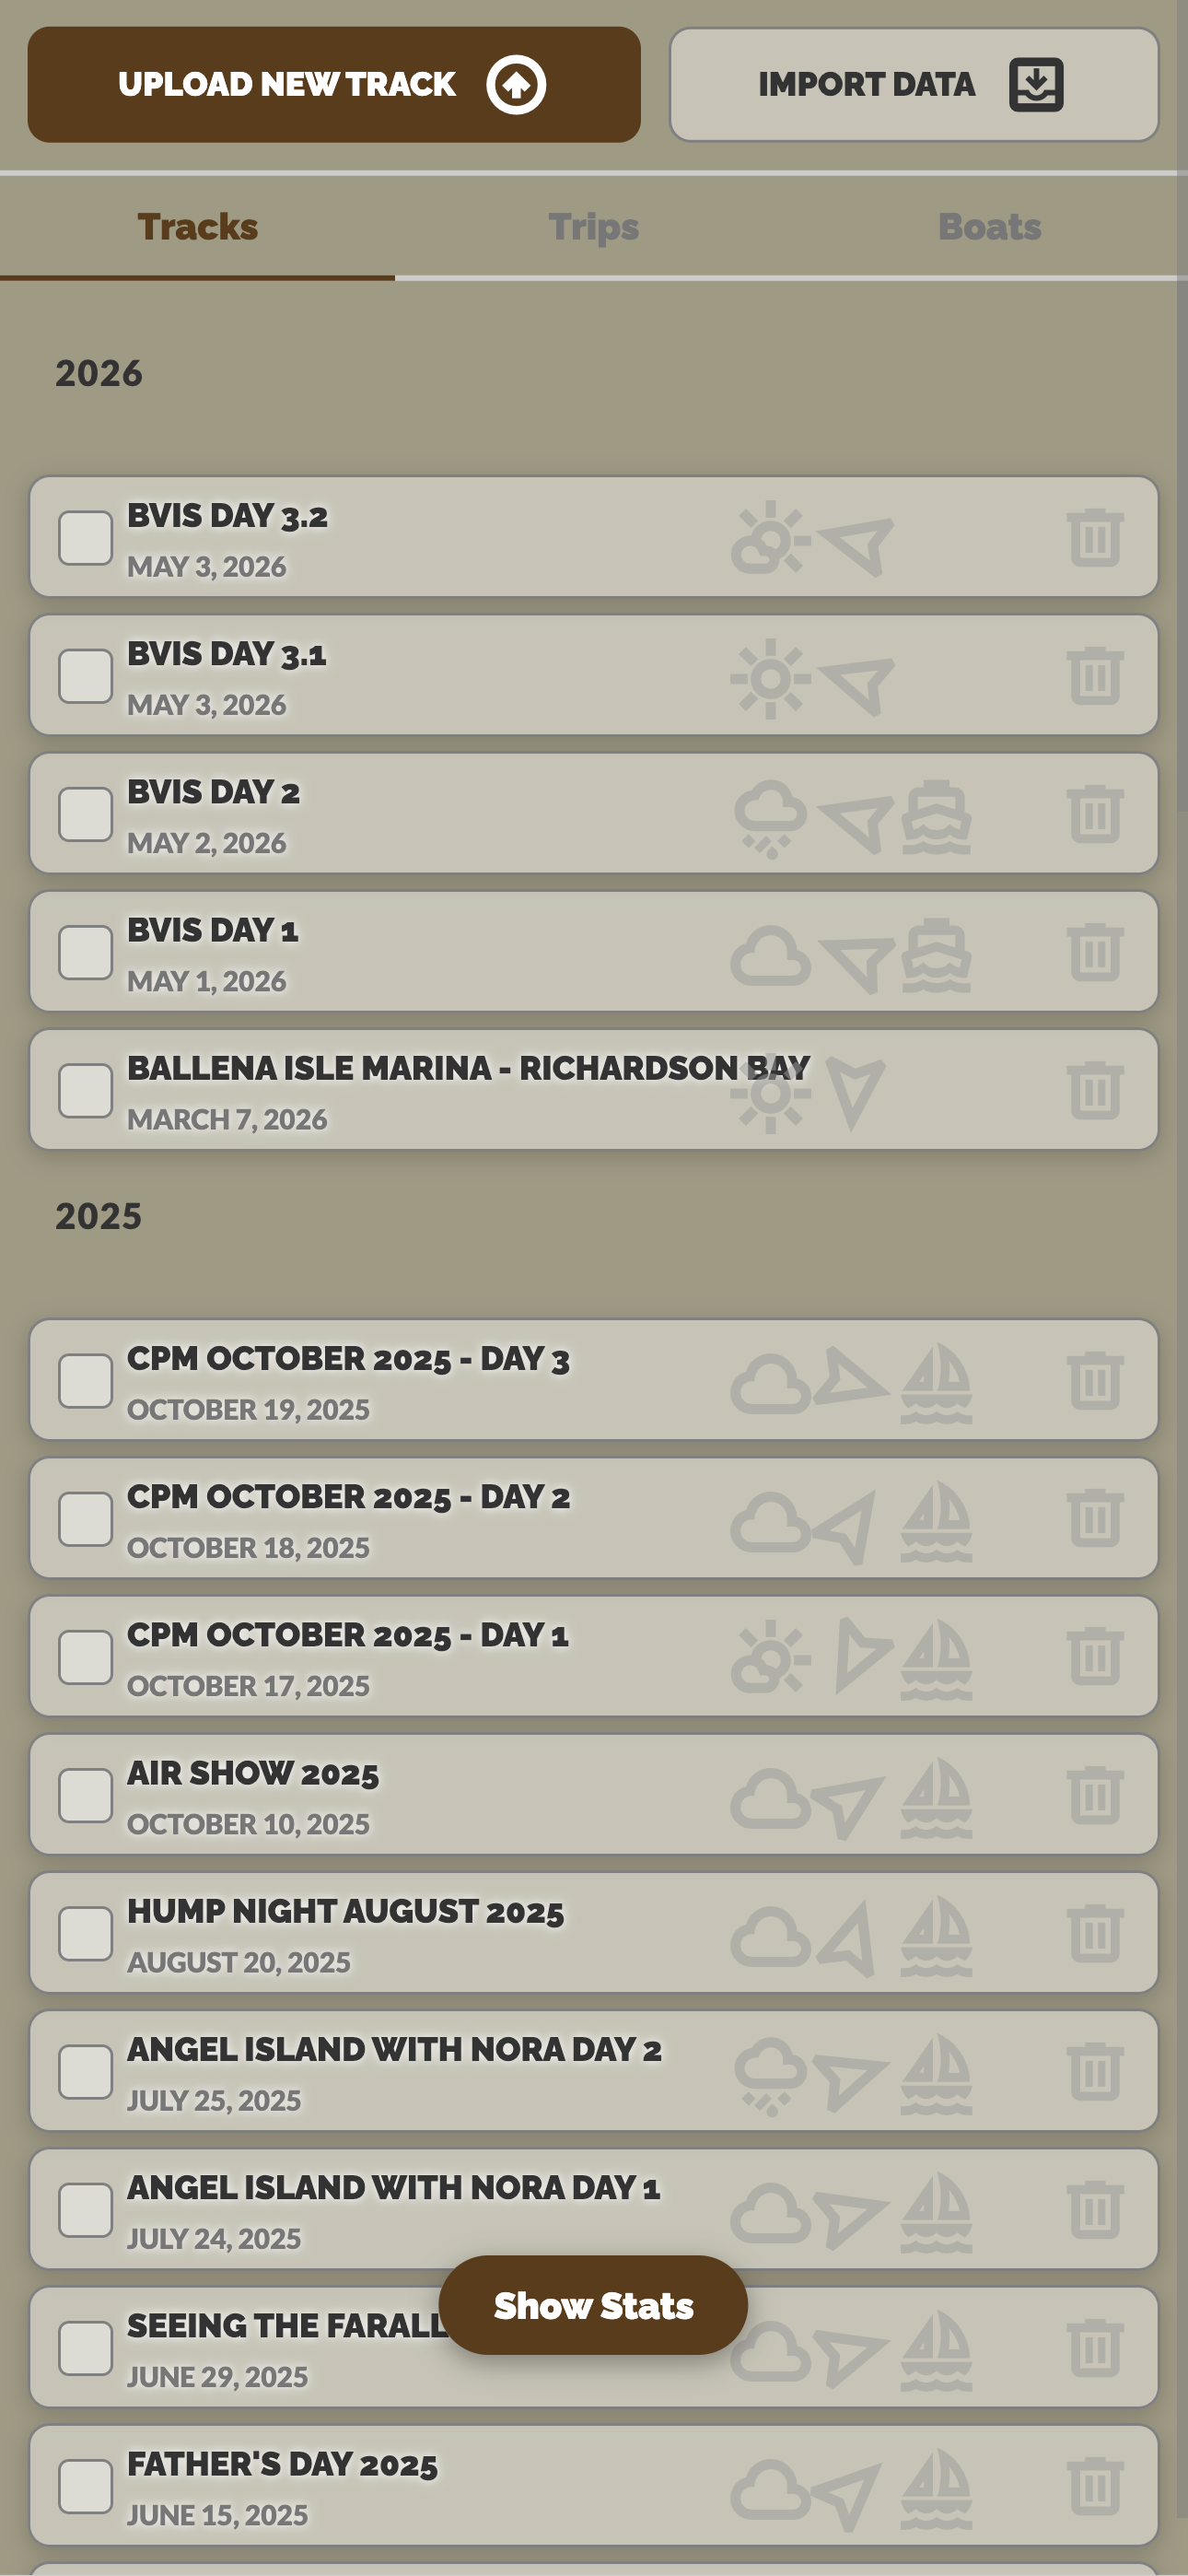
There are three main objects in Wakelog — tracks, trips, and boats — which you manage from the panel on the left side of the screen.
Getting Started
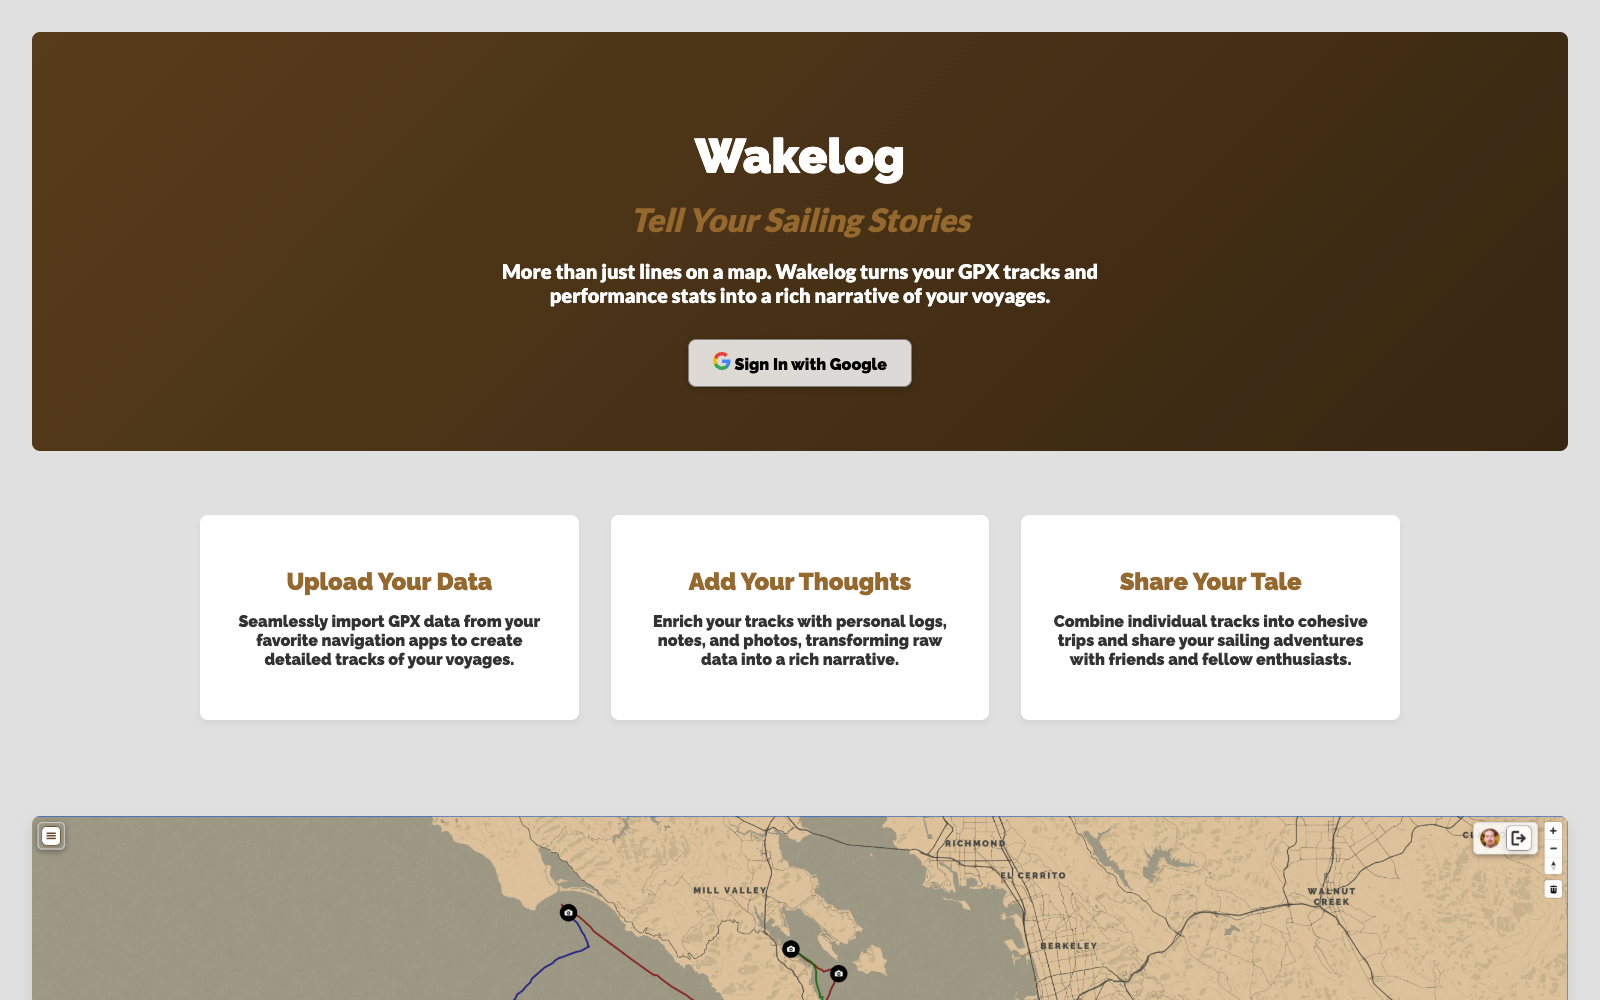
Wakelog uses Google sign-in for authentication. You must have an account to upload tracks or manage data — shared links are viewable without logging in.
-
1Sign in — Click Login with Google in the centre of the screen and authenticate with your Google account.
-
2Add a boat — Before uploading tracks, head to the Boats tab and add at least one vessel. Tracks can be associated with a boat later, but having one ready helps.
-
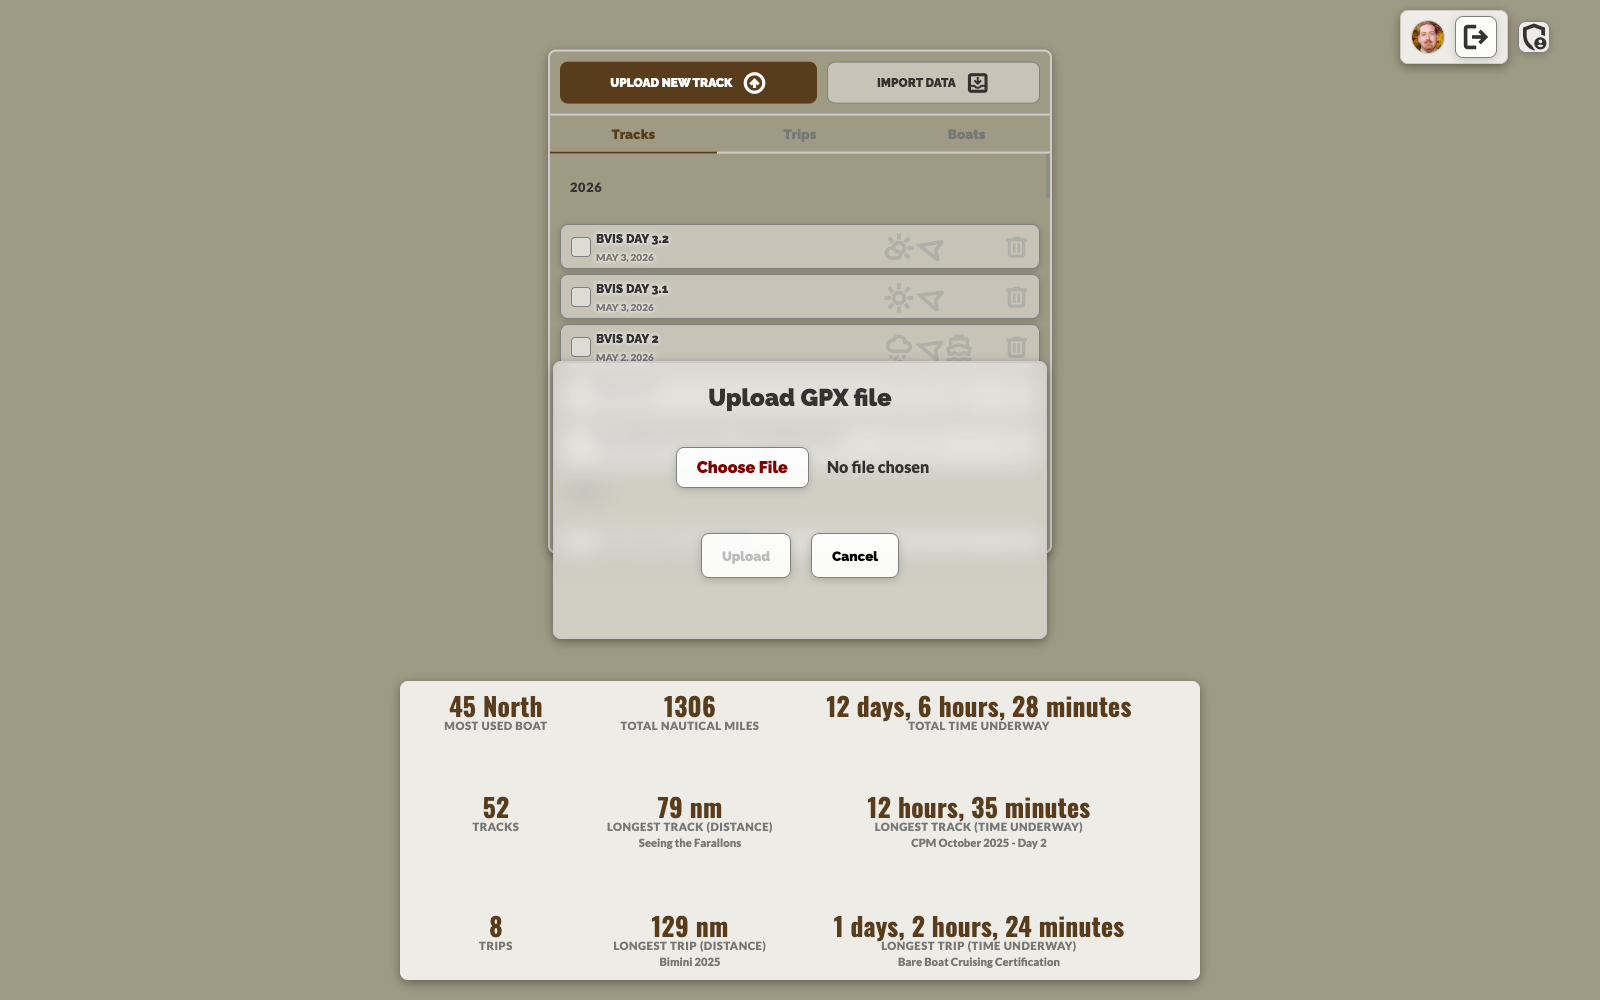
3Upload your first track — Click Upload New Track at the top of the panel. Select a GPX file from your computer and Wakelog will import the route and compute distance, duration, and speed statistics automatically.
-
4Explore the map — Your track appears as a coloured line on the globe. Click on it in the left panel to open the detail view with full stats and weather data.
Uploading Tracks
Wakelog accepts GPX files — the standard format exported by almost every GPS chartplotter, handheld device, and sailing app. Each upload creates one track.
-
1Click Upload New Track at the top of the left panel.
-
2Select your .gpx file using the file picker. Wakelog parses the track points, computes distance, duration, average speed, and top speed, and draws the route on the globe.
-
3Weather is fetched automatically based on the track's start position and date — temperature range, wind speed and direction, and overall conditions are stored with the track.
-
4The new track appears in the Tracks list. Click it to open its detail view.
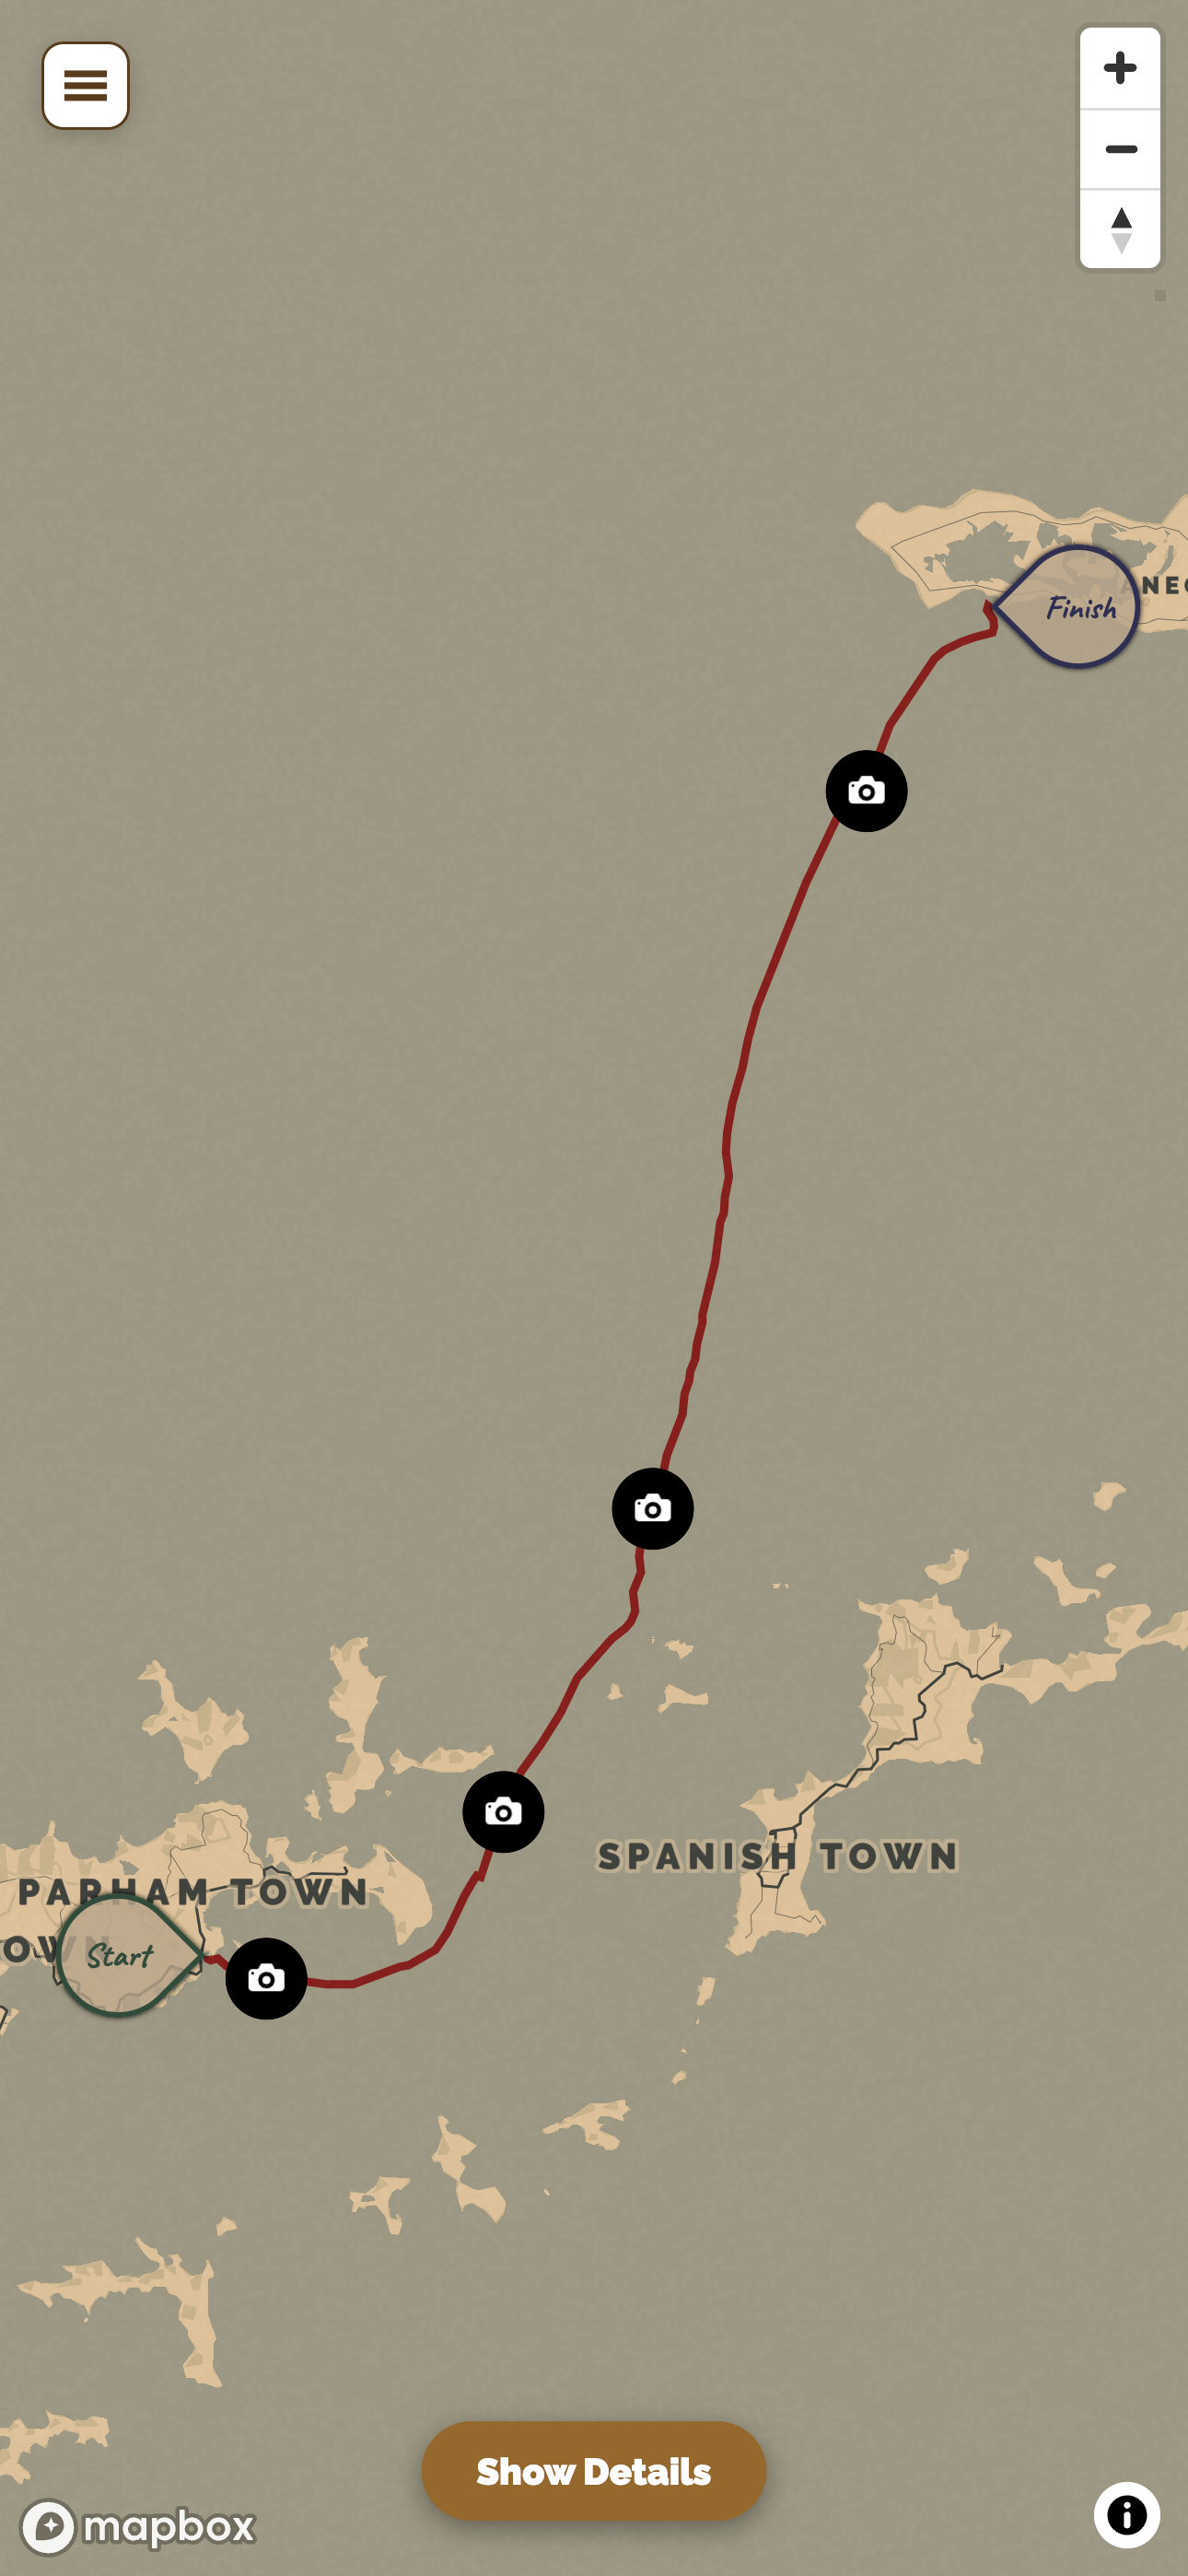
The Map
The map is a Mapbox globe that fills the main area of the screen. It shows your tracks as coloured lines and can display photo and note markers at the locations where they were added.
Track Details
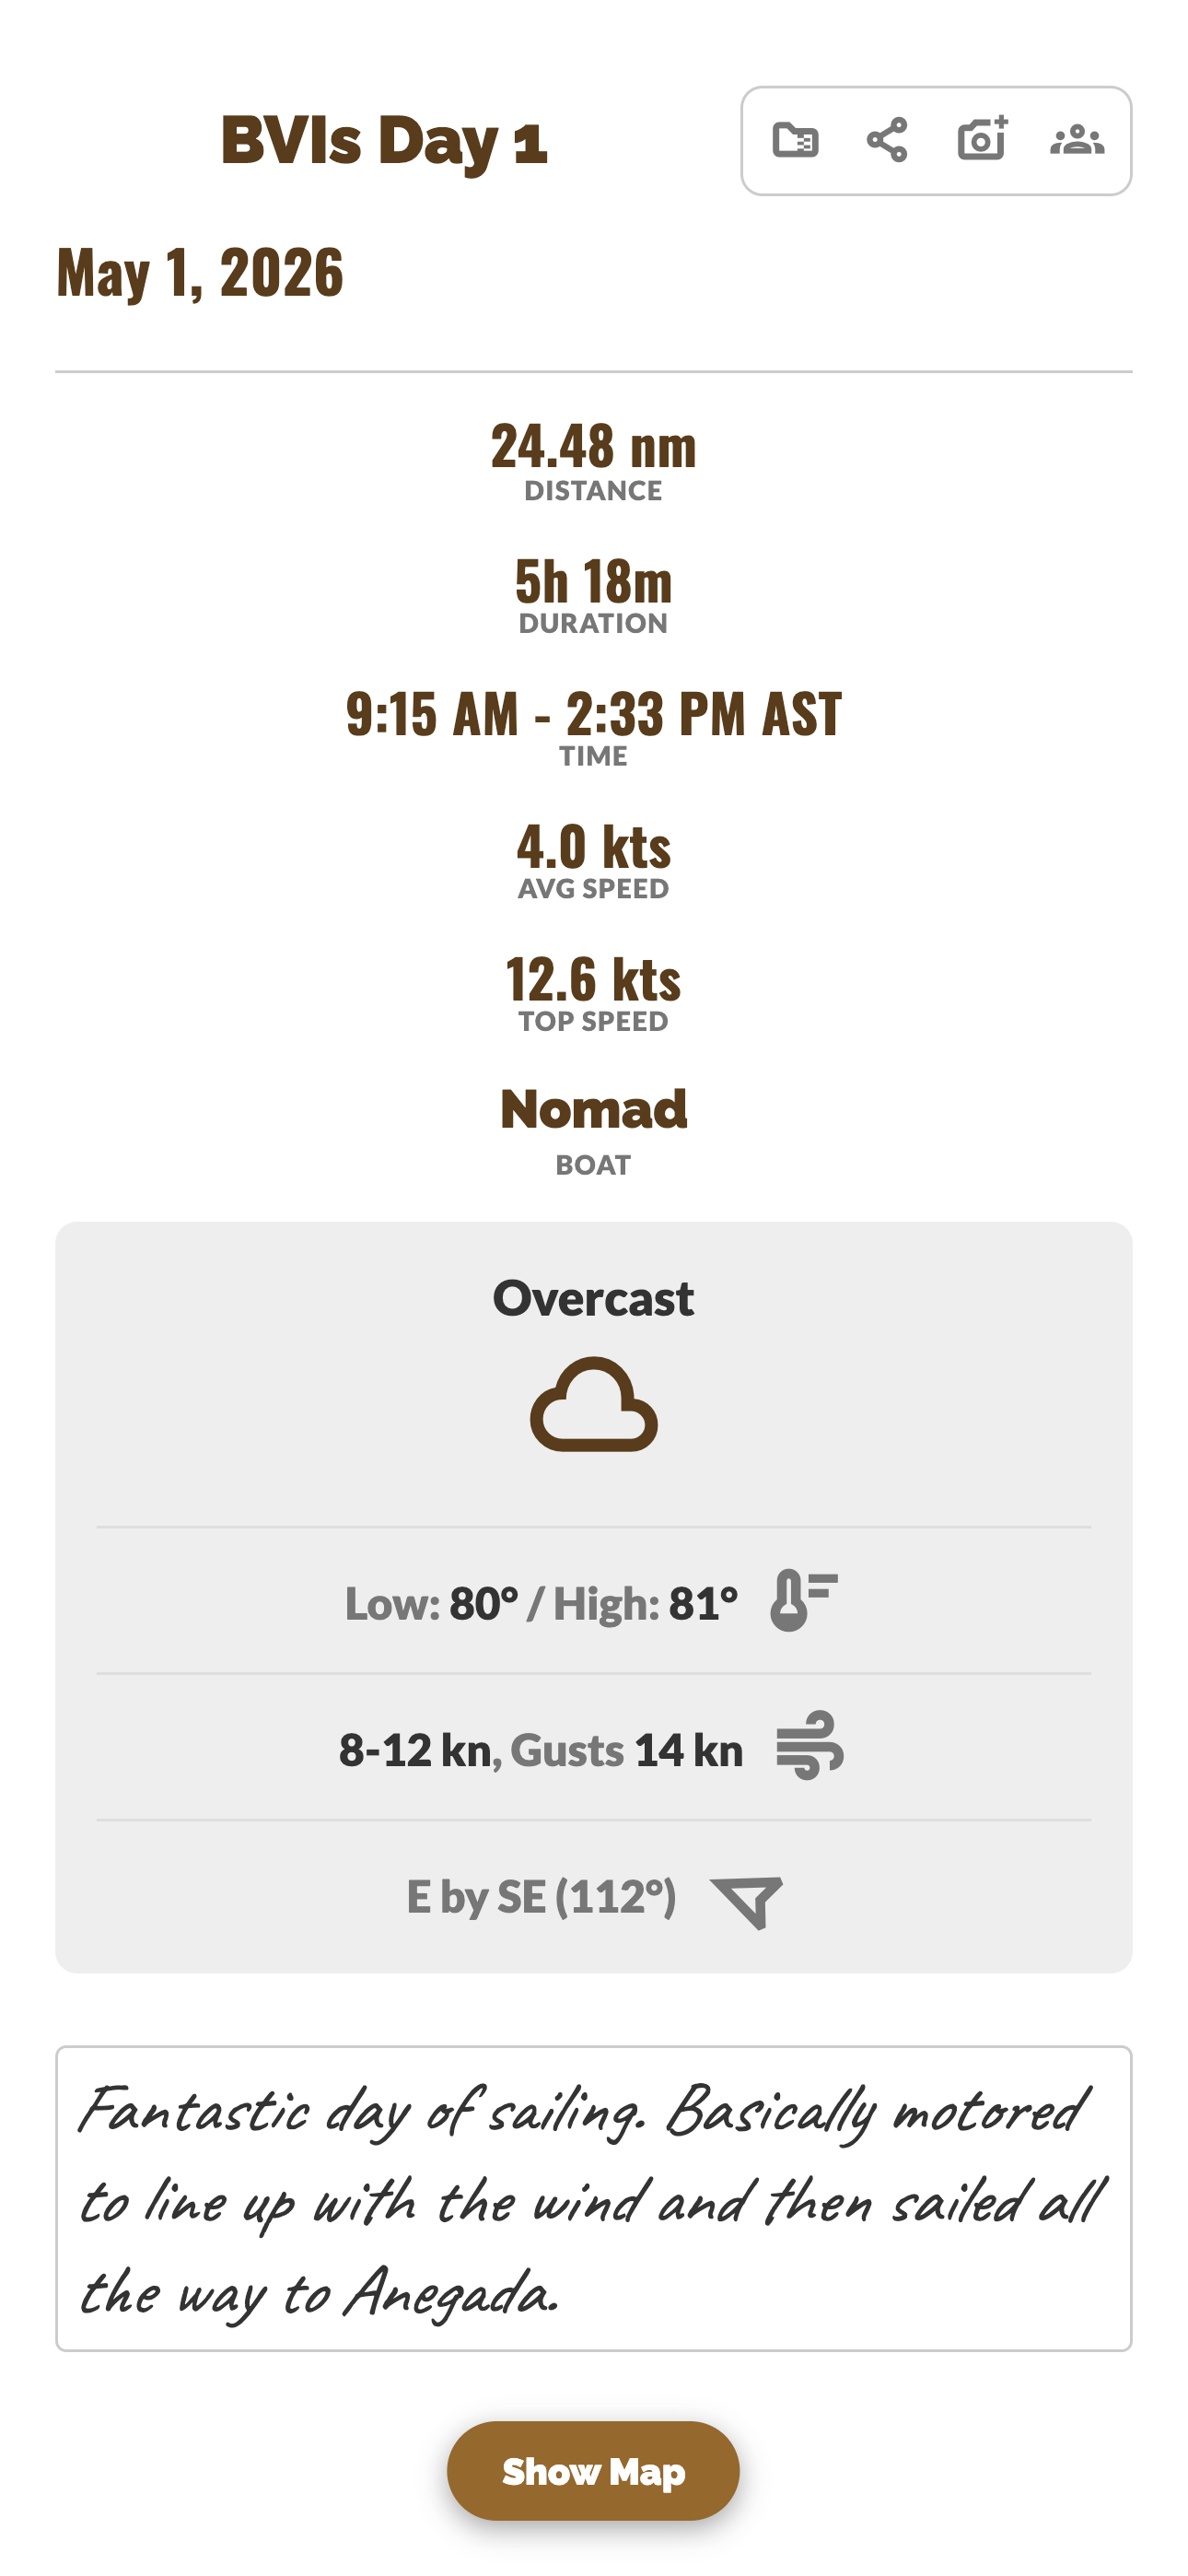
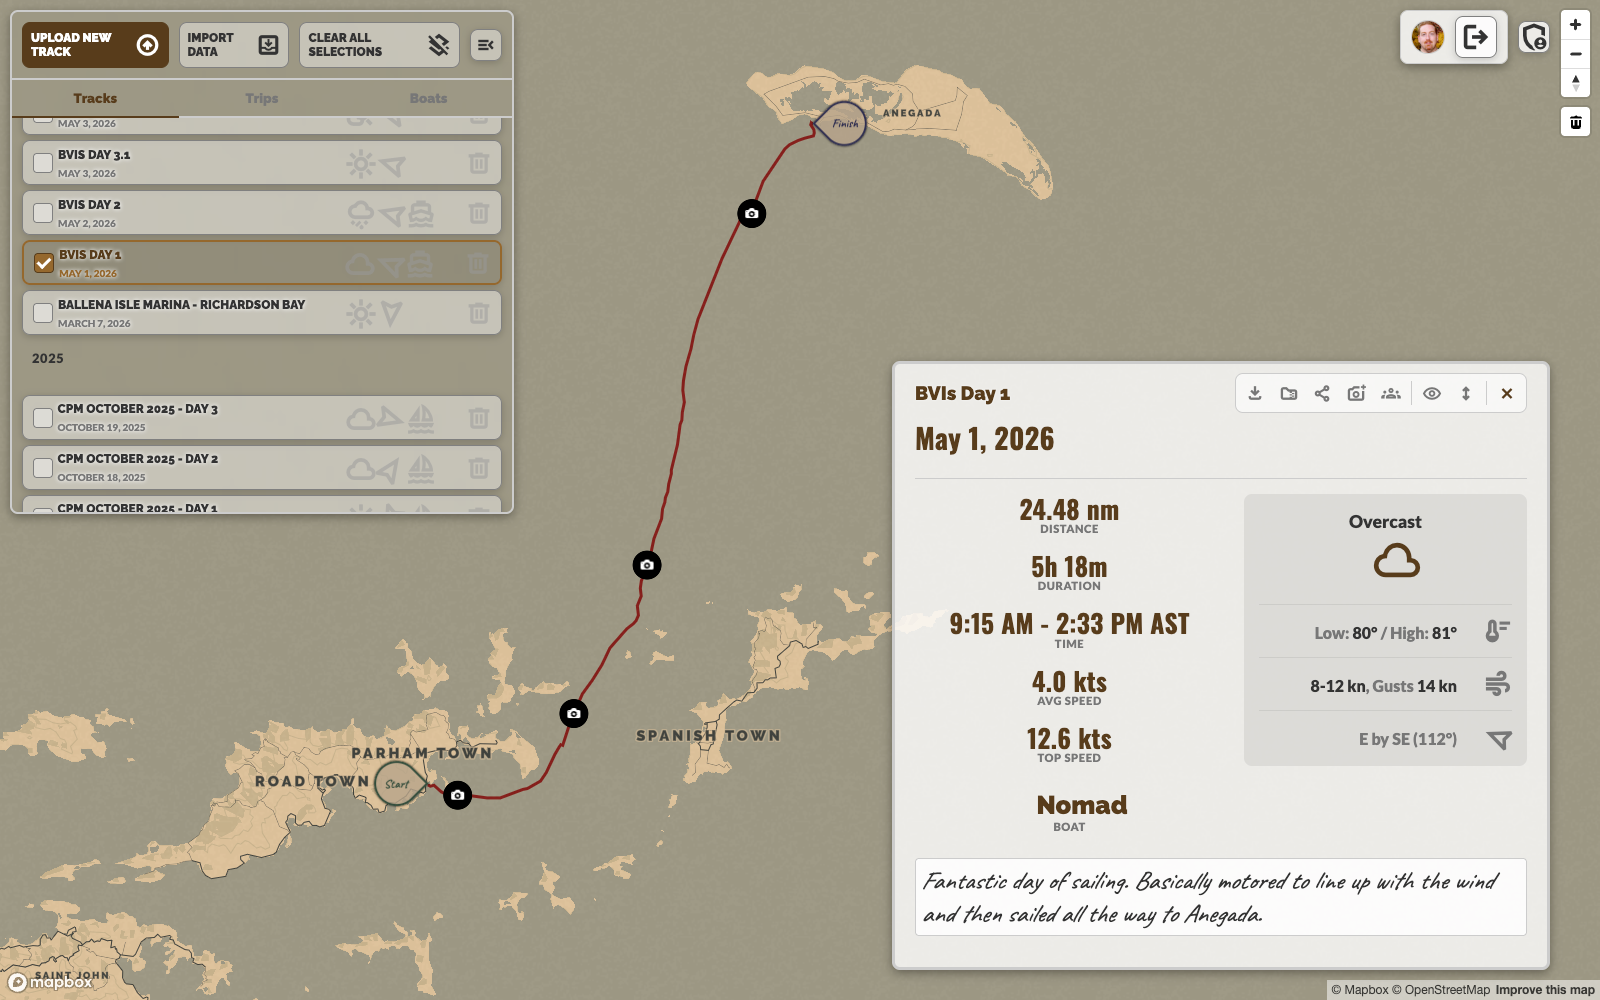
Clicking a track in the left panel opens its detail view — a panel at the bottom-right of the screen (desktop) or full-screen overlay (mobile) that shows all the data for that passage.
Toolbar actions — the icon bar in the top-right of the detail panel gives you quick access to:
-
downloadExport as PNG — Captures the current map view (with the track centered) and downloads it as a PNG image. Toolbars, panels, and UI chrome are hidden in the capture.
-
shareShare — Generates a read-only public link for this track that anyone can view without logging in.
-
editEdit — Opens a form to rename the track or change its colour. Track colour is also editable inline with the colour swatch next to the track name in the trip table.
-
add_a_photoAdd Photo — Upload a photo and pin it to a location on this track. See Photos & Notes for full details.
Trips
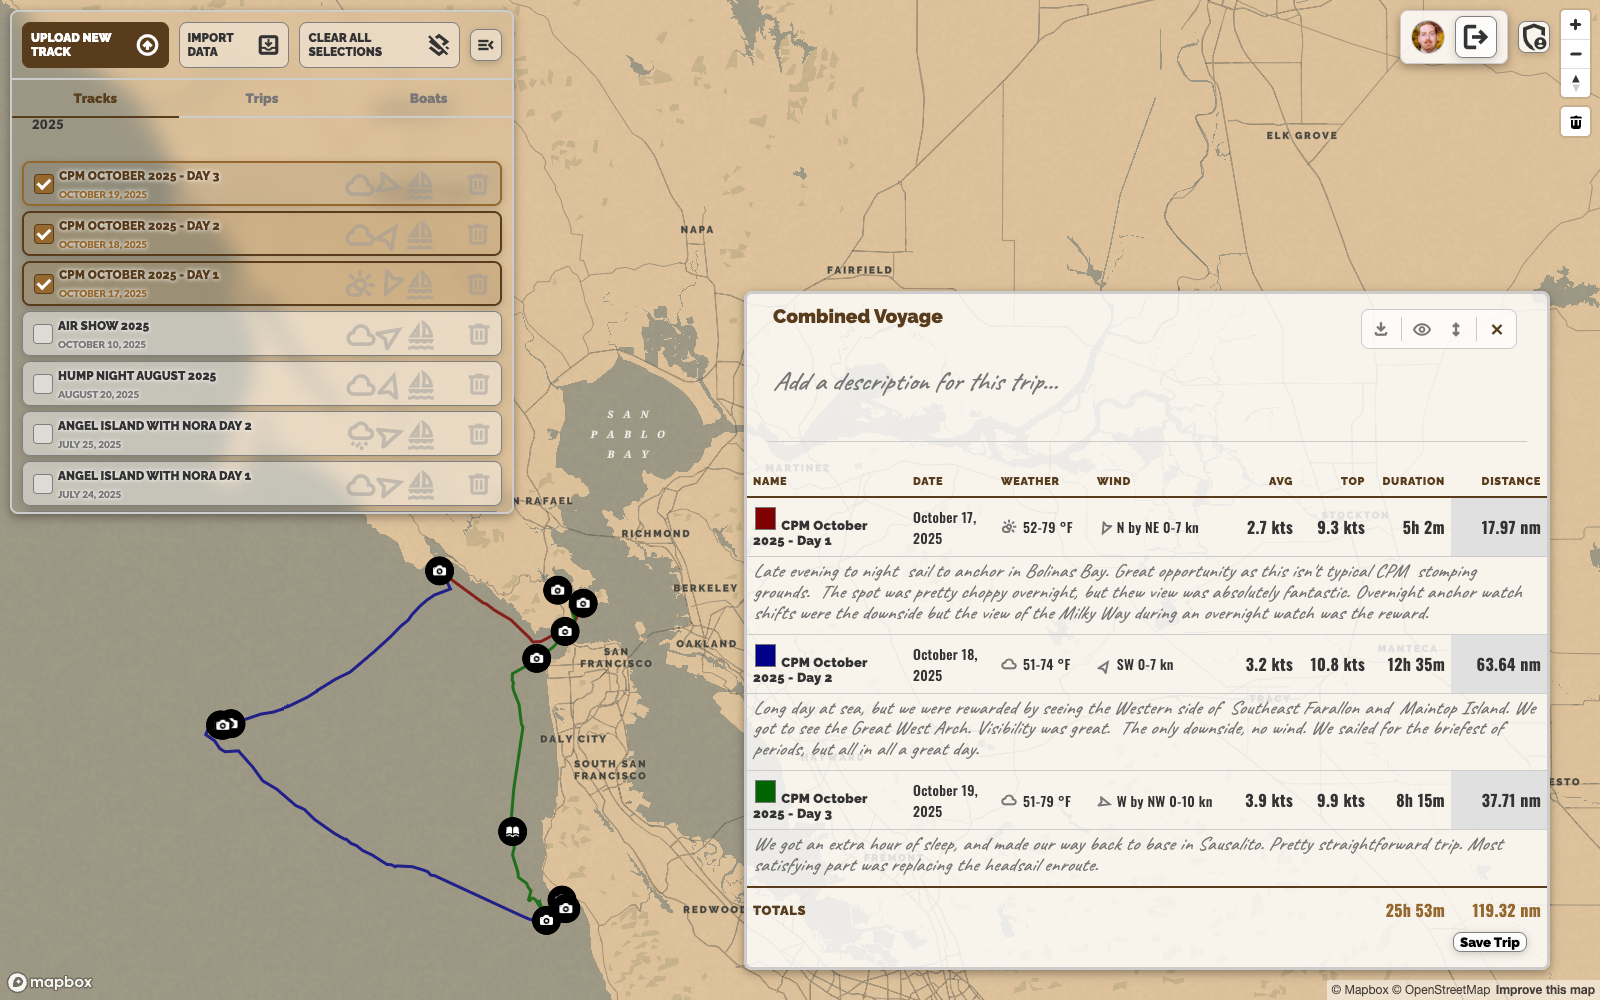
A trip groups related tracks together — think of it as a logbook chapter. A week in the BVIs might be one trip containing seven individual daily tracks. Trips get their own name, description, crew list, and a combined stats table.
-
1Create a trip — Switch to the Trips tab in the left panel and click + New Trip. Give it a name.
-
2Add tracks to the trip — In the Tracks tab, select one or more tracks using the checkboxes, then click Add to Trip from the action bar that appears. Choose the destination trip.
-
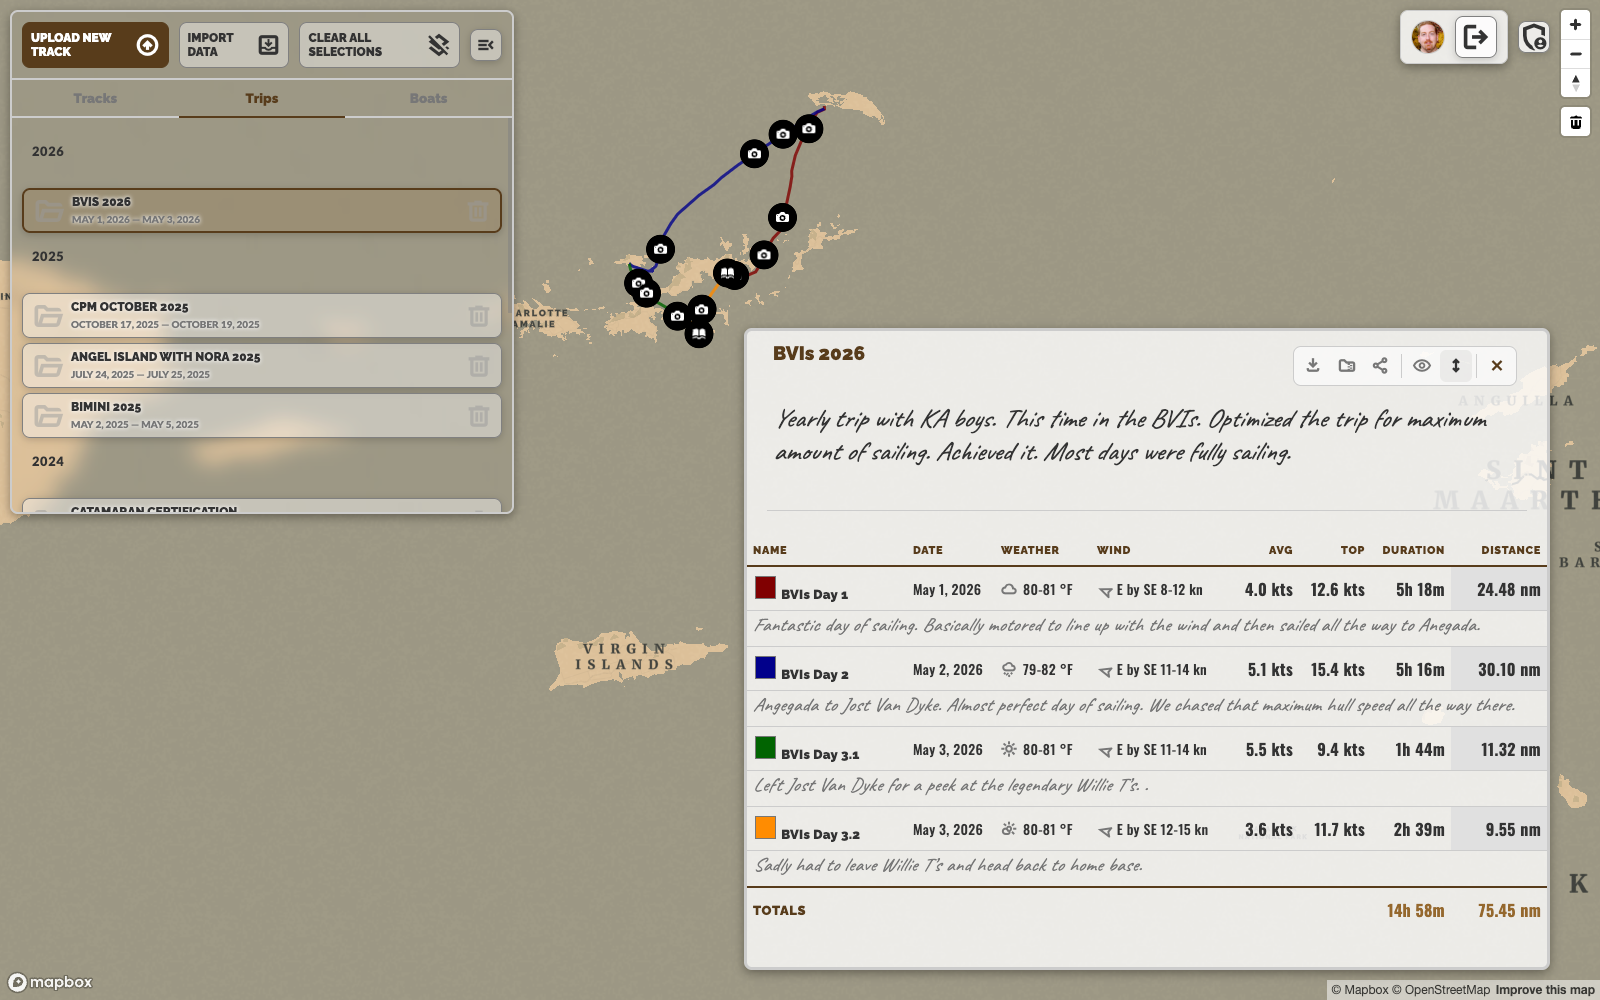
3View the trip — Click the trip in the Trips tab. All its tracks load onto the map simultaneously. The stats panel switches to the trip table view — a compact table showing each track's date, weather, speed, wind, distance, and duration in one place.
-
4Edit the trip — The trip name and description are editable inline. Click the title or description text in the stats panel to edit. Changes save automatically on blur.
-
5Add crew — Click the crew button in the trip toolbar to open the crew manager. Add or remove people from the trip roster.
Photos & Notes
Photos and notes let you annotate a track with images and text pinned to specific locations on the map. They appear as markers on the globe so you can always find them in context.
Adding a photo
-
1Open the track you want to annotate and click the button in the toolbar (or the same button that appears in the mobile legend).
-
2Select an image file from your device. The photo uploads and a camera marker appears on the map at the track's default midpoint location.
-
3Click the marker to open the photo. Add a caption by clicking in the caption field below the image — it saves automatically when you click away.
-
4To delete a photo, open it and click the delete button in the bottom-right corner of the modal.
Adding a note
-
1Select a track, then click the note button to open the note editor.
-
2Type your note text. The note is saved when you click Save. A pen marker appears on the map at the track location.
-
3Click the pen marker on the map at any time to read or edit the note.

Boats
The Boats tab is your fleet registry. Adding your vessels lets you associate each track with the boat it was sailed on, building a proper multi-vessel logbook over time.
-
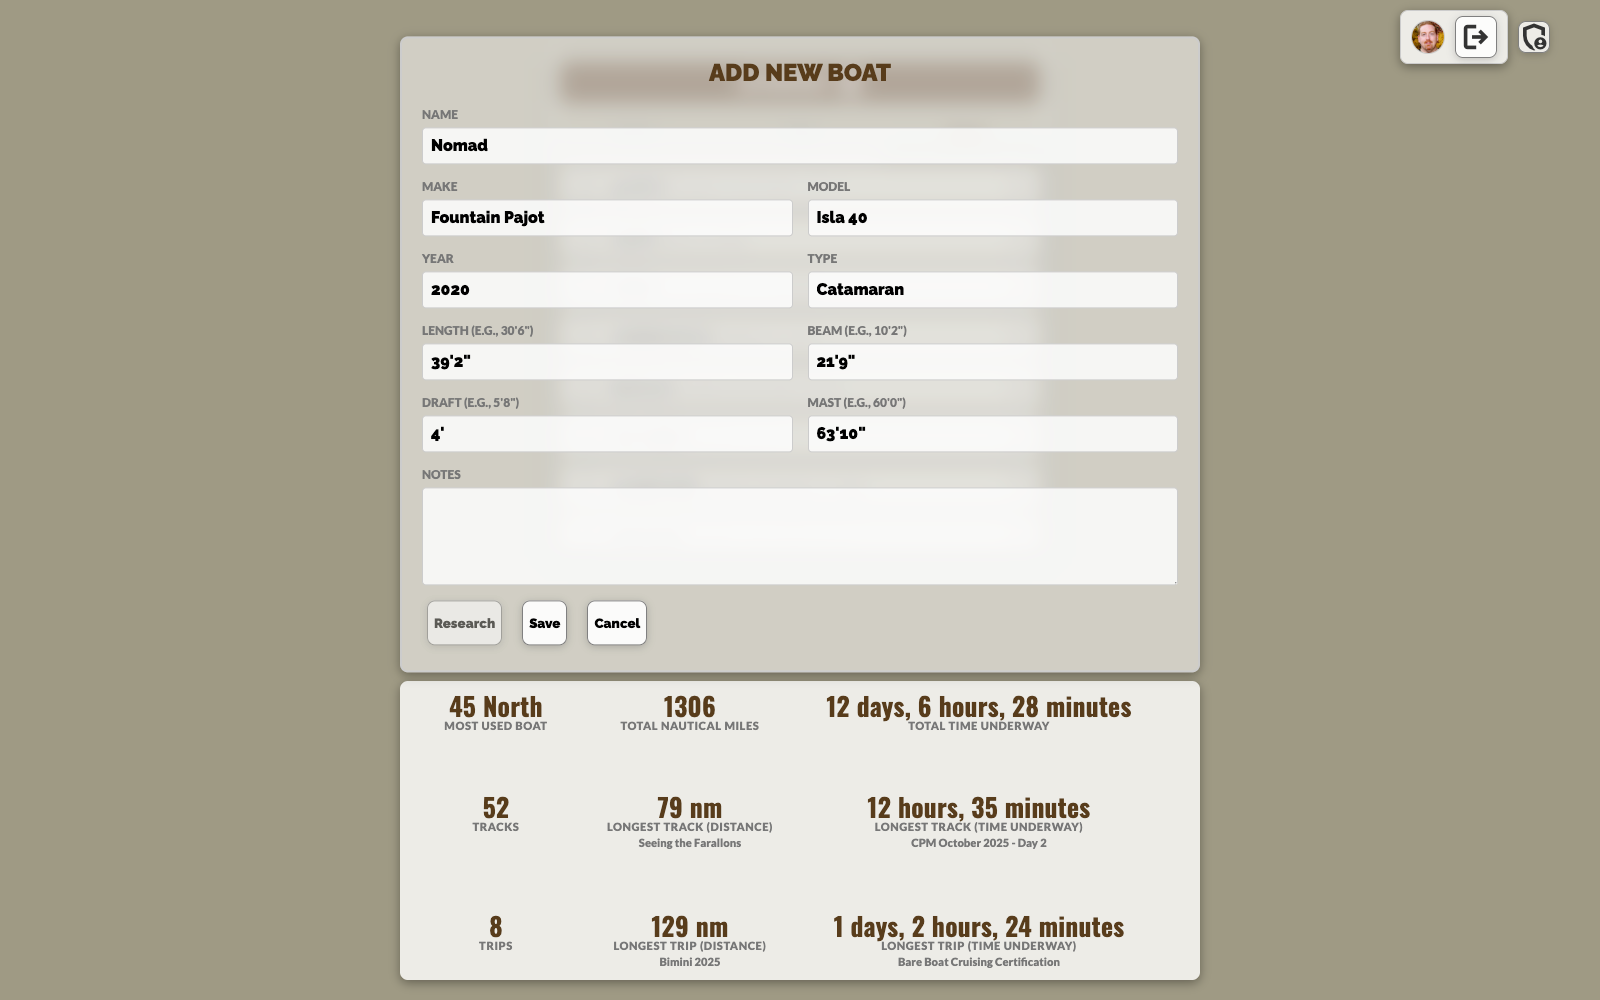
1Switch to the Boats tab and click + Add Boat. Enter the boat's name, type, and dimensions.
-
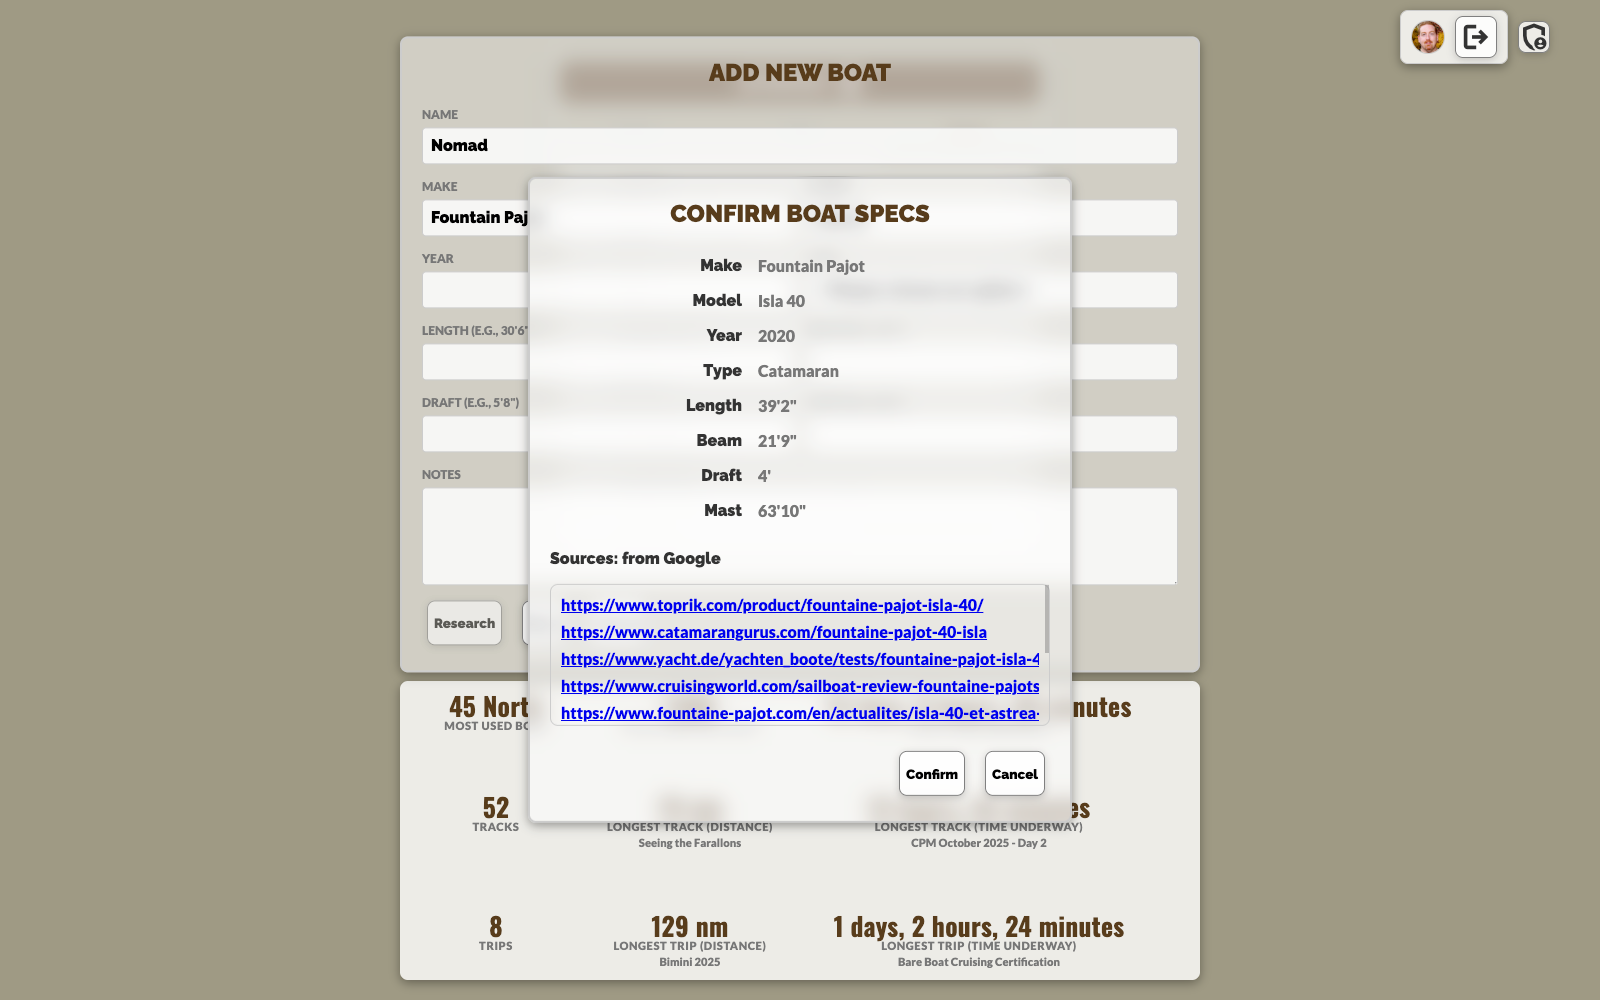
2AI Boat Lookup — Click Look Up Boat after entering a name and Wakelog's AI agent (backed by Gemini with Google Search) will attempt to find published specifications for that vessel and pre-fill the fields.
-
3Review and confirm the AI-suggested specs before saving. The agent shows you what it found and asks you to approve.
-
4Once a boat is saved, associate tracks with it by opening a track's detail view and choosing the vessel from the boat selector at the bottom of the stats panel.
Sharing
Wakelog can generate a secure, read-only public link for any track or trip. Recipients can view the map, stats, photos, and notes without needing a Wakelog account.
-
1Open a track or trip, then click the share button in the toolbar.
-
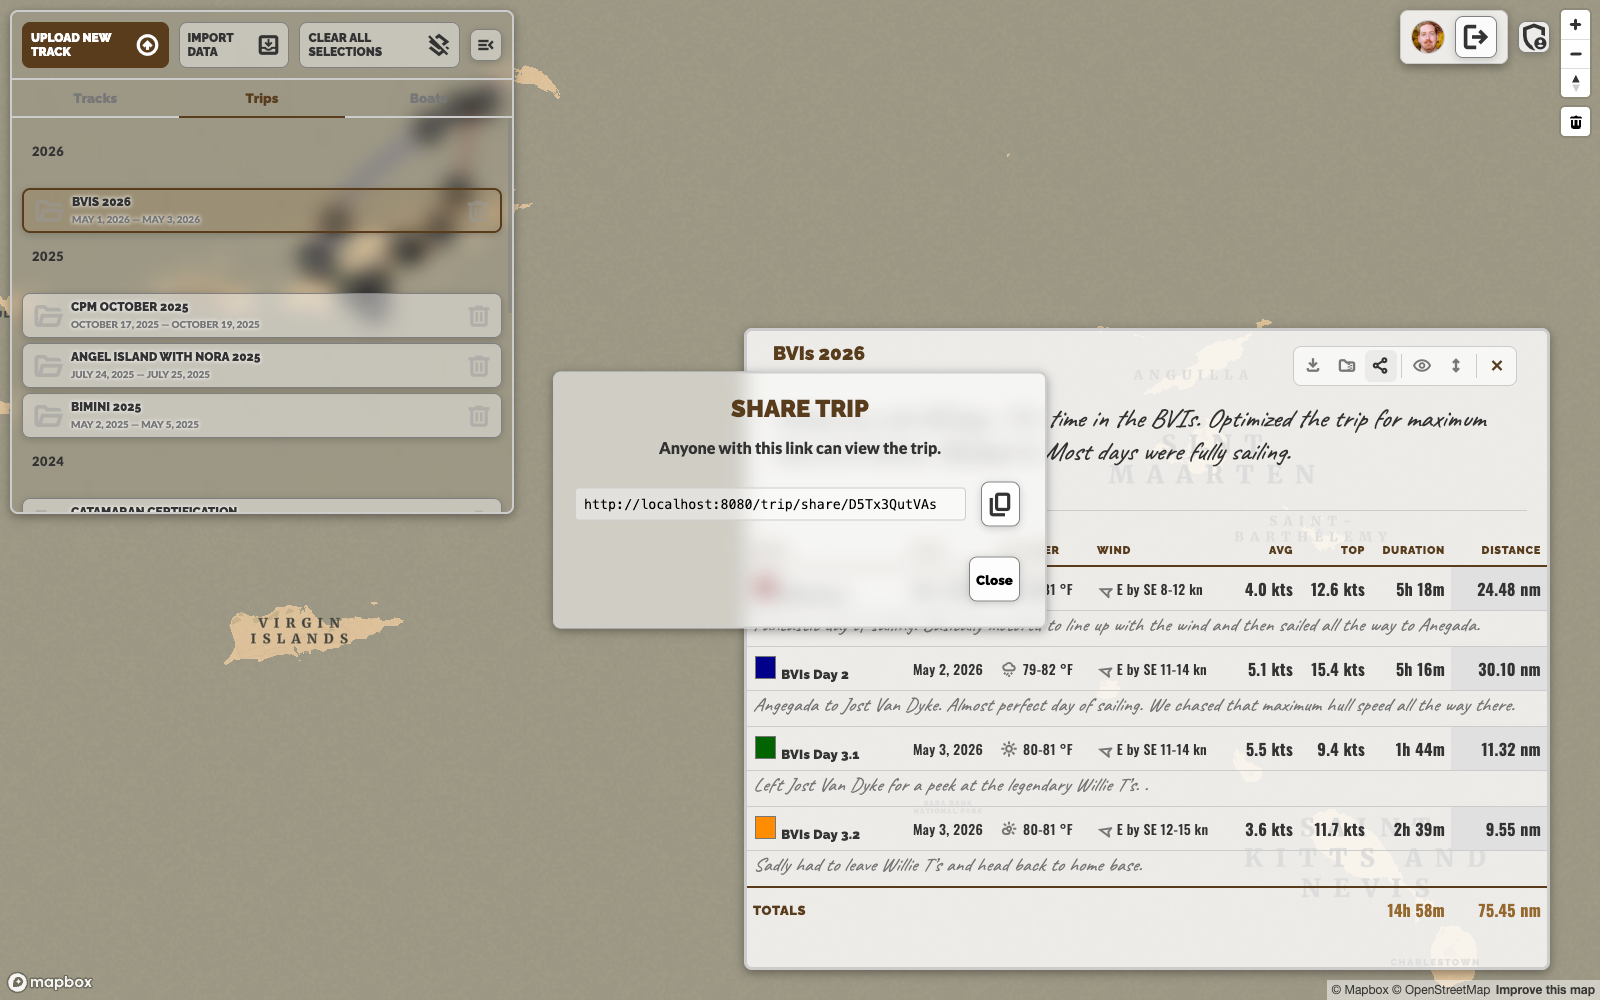
2A unique link is displayed. Click Copy and send it to anyone — crew members, family, or your sailing club.
-
3The recipient sees the track or trip in a read-only view — the map, stats table, photos, and notes are all visible, but no editing controls are shown.
-
4To revoke the link, open the share dialog again and click Revoke. The link becomes immediately invalid.
Export & Import
Wakelog lets you export and import full trips as ZIP archives, and export the current map view as a PNG image. These tools are useful for backups, migrating data between accounts, or creating social media posts.
Export a trip as ZIP
-
1Open a trip in the Trips tab and click the export button in the trip toolbar.
-
2A ZIP file is downloaded containing all track GPX files, weather data, descriptions, and trip metadata — everything needed to restore the trip on import.
Import a trip ZIP
-
1Click Import Data at the top of the left panel.
-
2Select a Wakelog trip ZIP file. All tracks, weather, descriptions, and the trip record are restored in one operation.
Export map as PNG
-
1Open a track or trip and click the download button in the toolbar.
-
2Wakelog hides all UI panels, captures the map at its current view and zoom, then downloads
wakelog-capture.png. The track lines and markers are preserved in the image.
Using Wakelog on Mobile
Wakelog is fully responsive and works on phones and tablets. The layout adapts to a stacked view: the track/trip list occupies the top portion of the screen, with the map and stats panel below.